- Fri 03 July 2020
- research
- Lyla Sanders
- #bicycle, #web application

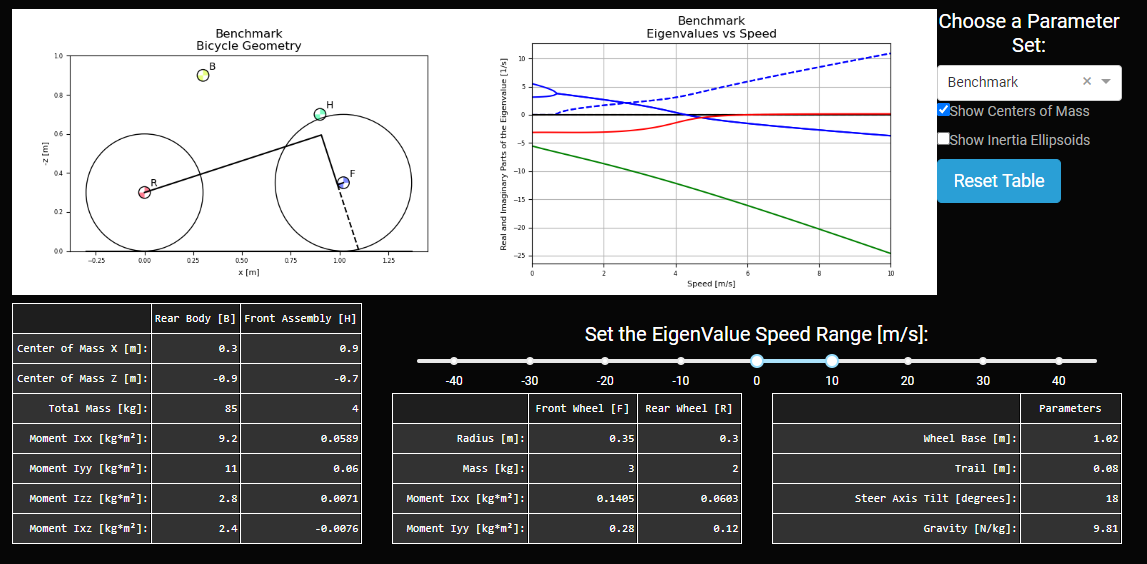
Screenshot of the bicycle dynamics web app. Click the image to go to the app at https://bicycle-dynamics.onrender.com.
Background
The BicycleParameters Python program provides a way for users to interact with the 27 parameters laid out by the Whipple-Carvallo bicycle model. However, its accessibility is limited to the programming experience of the user, and it can be unweildy to manually work with. To make the program more accessible, the Bicycle Dynamics Web App was created to supply a graphical user interface for the program as well as to enable a broader range of users to access it via the web. The web app takes heavy inspiration from JBike6, but aims to remove the accessibility barriers inherent to MATLAB.
Building the App
Given that BicycleParameters was to be used as the backend for the website, it made sense to use another Python based program to build the frontend. Dash from Plotly serves this purpose perfectly, providing us with a full set of html components in addition to many custom made Javascript elements such as datatables and value sliders. Finally, the app is styled with Dash Bootstrap Components, so that only a very minimal amount of custom CSS had to be written.
Functionality
The Bicycle Dynamics Web App provides a graphical interface with 10 different default parameter sets, a set of editable tables where users may adjust the parameter values as they see fit, and two plots which are generated behind the scenes from the datatable values. The geometry plot displays the essential schematic and centers of mass of the bicycle, while the eigenvalue plot reveals the self-stability of the bicycle as a function of its speed. Users may toggle the centers of mass and intertia ellipsoid on the geometry plot, and they may adjust the speed range for the eigenvalue plot.
Conclusion
The Bicycle Dynamics Web App is currently deployed at https://bicycle-dynamics.onrender.com and its github repository is located at https://github.com/moorepants/BicycleParameters. Feel free to play around with the app and provide suggestions or feedback!

