
- Thu 27 December 2018
- research
- Aaron Shaw, Rayming Liang
- #efficiency, #treadle pump, #engineering, #biomechanics, #appropriate technology
Introduction
Small scale farmers use human-powered water pumps in rural areas to increase crop yields beyond subsistence levels. Different designs utilize various biomechanical motions. One of the most popular and proven designs for human-powered water pumps is the treadle pump, which is operated via a stepping motion (Figure 1).
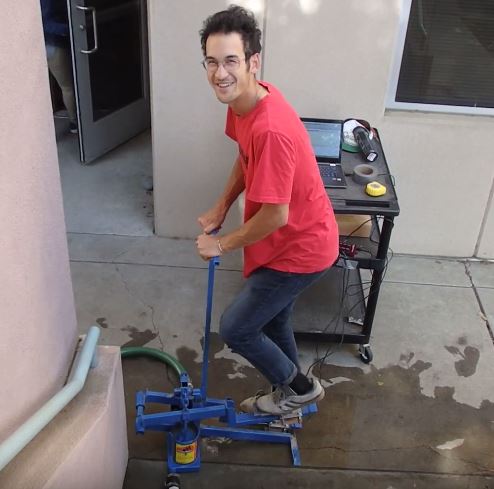
Figure 1. A user "treadles" on the Money Maker treadle pump.
The treadle pump is an inexpensive and portable irrigation tool. According to International Development Enterprises (IDE), treadle pumps helped farmers in Bangladesh increase their income by an average of $100 a year. This increase in profit allowed farmers to invest in larger, more expensive irrigation machines that further increased crop yields and helped create financial stability [Polak].
A prototype pedal-powered centrifugal water pump was tested by Abe McKay during his Master’s studies [McKay]. Mckay’s tests suggested that this pump’s efficiency was comparable to that of the commercially available Xylem and Money Maker treadle pumps. Detailed efficiency data for these treadle pumps are not available and thus an accurate comparison could not be made until now.
For our experiment, we gathered efficiency data from the Xylem and Money Maker treadle pumps and compared them to McKay’s data on the prototype Buffalo pump. By comparing the efficiency of the Buffalo pump to the commercially available Xylem and Money Maker pumps, we can evaluate the prototype’s potential for success as a low cost tool for small scale irrigation.
Methods
McKay had conducted an efficiency test with the centrifugal pump so our goal was to conduct a similar test with our treadle pumps in order to produce data that could be compared. We conducted fifteen tests, with three replicates at each pressure head between 1 and 5 meters. We pumped 20 liters of water for each test. We measured time using a photoresistor that was covered and uncovered (on/off) to record the beginning and end of each test. The DAQ apparatus including photoresistor circuit, sensor wires, and LabJack is shown in Figure 2 below.
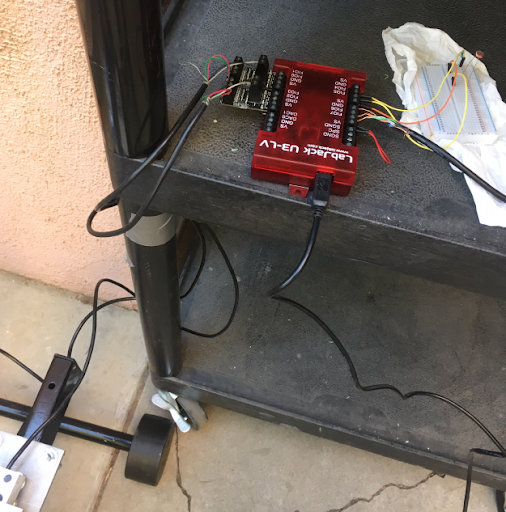
Figure 2. The LabJack was kept dry and out of danger behind the treadle pump.
Force sensors were designed using steel plates and two 200 kg rated load cells. The load cells were mounted between steel plates and then mounted on the treadle pump lever arms with U-bolts. We calibrated the force sensor using Olympic weights and a balance scale for reference. The power meter apparatus consisting of the force sensors and angular rate gyro are shown below in Figure 3.
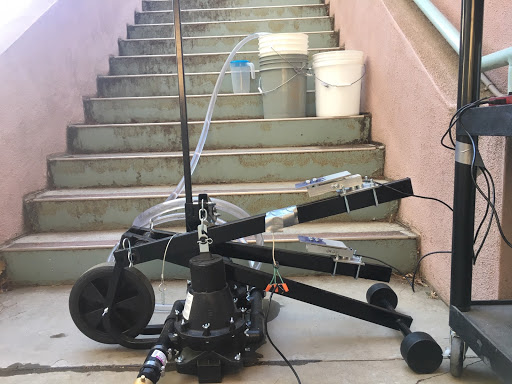
Figure 3. The Xylem treadle pump with force sensor and angular rate gyro attached
We measure force and angular rate using the force sensors and the angular rate gyro respectively. Using our force measurements, we were able to calculate torque using the equation below:
where \(F\) is the force in Newtons applied to the lever arm perpendicular to the arm. The radius \(r\) is the distance from the point of applied force to the lever arm’s center of rotation. Using torque and angular rate measurements from the angular rate gyro, power in watts is calculated using the equation below:
where torque 𝛕 is in Newton-meters and angular velocity 𝛚 is in radians per second. Time required to fill the 20 liter bucket was measured and used to calculate flow rate. Hydraulic power could then be calculated using the equation:
Simplifying for water, where density equals 1 kilogram per liter:
where \(q\) is measured in liters per second, \(g\) is 9.81 meters per second squared, and \(h\) is vertical pressure head measured in meters. Efficiency can be calculated using the equation below:
Hazen efficiency is determined by calculating the friction head loss using the Hazen-Williams equation:
Hydraulic power is adjusted using this estimated friction head. A Hazen efficiency can then determined.
Each test began with one person priming the pump in order to achieve consistent water flow. The collector would deliver the pumped water into an overflow bucket until the experiment began. At the start of the experiment the treadler would remove a piece of paper covering the photoresistor. Simultaneously, the collector would transfer the outlet hose to the 20 L metered collection bucket. During the data collection, the treadler would attempt to maintain an average of 100 Watts. This was done by feel only and therefore resulted in some deviation from the target power. The experiment ended when the collector signaled to the treadler that 20 L was reached, at which point the photoresistor was covered and the data collection complete. The data was collected via a MATLAB program and saved after each trial. 15 trials were completed: three at each meter interval between 1 and 5 meters.
Results
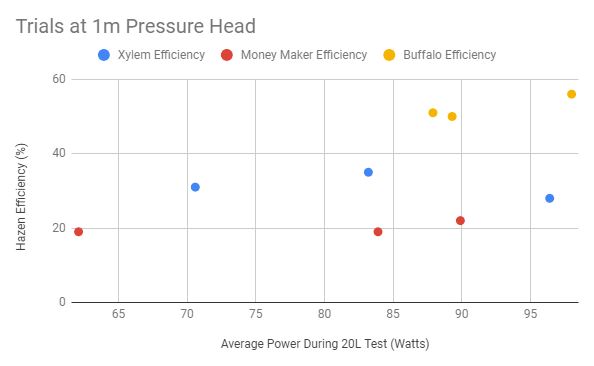
Figure 4
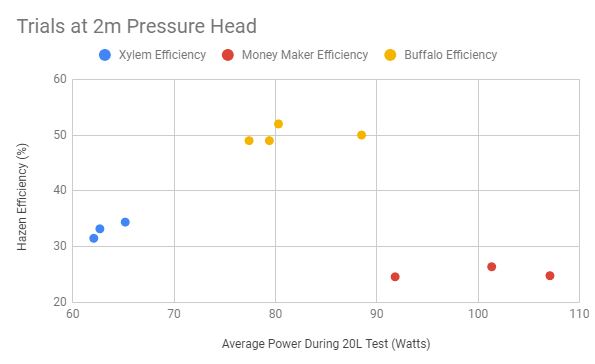
Figure 5
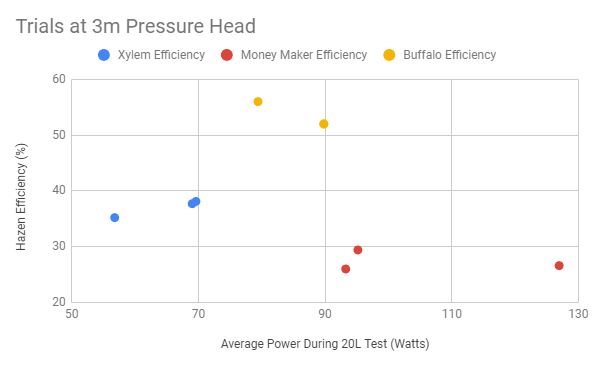
Figure 6
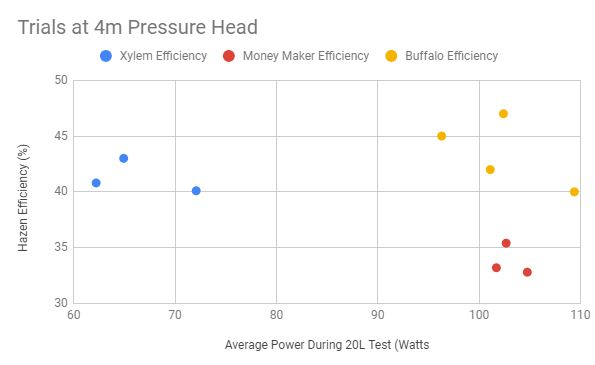
Figure 7
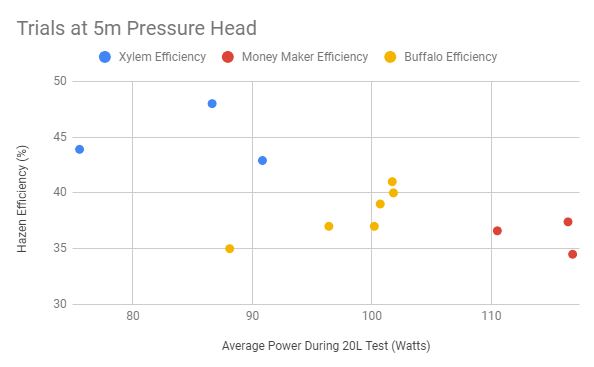
Figure 8
The figures 4-8 above show the calculated efficiencies for each pump at different pressure heads across all trials. The average efficiencies are graphed in figure 9 below.
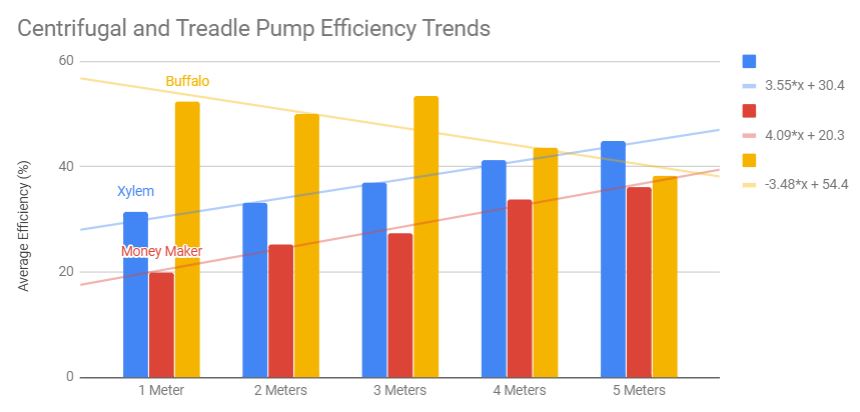
Figure 9
Figure 9 shows the efficiency trends across different pressure heads for each pump. The average efficiency was found by finding the mean across the three trial tests at each pressure head. The effect that the variation in power may have had on efficiency was assumed to be negligible. The trendlines and corresponding equations are shown.
Discussion
There is a variation in average power within each testing group that must be acknowledged. Because the average power for each testing group was not held constant, we must consider the relationship between power and efficiency. When the trendlines for each testing group are observed, our data does not suggest a strong relationship between average power and efficiency within a given pressure head. More data points and a dedicated testing procedure would help validate this claim, but the observed results are enough to make the assumption that the effect of any hypothetical correlation is negligible given the range over which average power varied during our tests. Therefore, the average efficiencies can be compared between pumps where pressure head is held constant despite fluctuating average power measurements across trials.
Figure 9 shows the average efficiencies for each pump at various pressure heads. The centrifugal Buffalo pump has a negatively sloped trendline whereas the treadle pumps have positively sloped trendlines when observed between our range of pressure heads. The Xylem pump surpasses the efficiency of the Buffalo pump around 4.5 meters pressure head. The Money Maker pump can be predicted to surpass the efficiency of the Buffalo pump at around 5.5 meters pressure head. The Xylem and Money Maker pumps share a similar relationship between increased pressure head and increased efficiency. There is a difference in slope between the two trendlines of 0.54. Due to shared mechanical properties, all treadle-type pumps most likely produce similarly sloped trendlines. The centrifugal Buffalo pump is a completely different design, and thus its efficiency can be predicted along a completely different trendline.
The Buffalo pump is determined to be 21% (𝛔 = 6.7%) more efficient at 1 meter pressure head than the Xylem pump, and 32% (𝛔 = 4.9%) more efficient at the same head when compared to the Money Maker. At 2 meters pressure head, the Buffalo pump was 17.0% (𝛔 = 2.9%) and 24.7% (𝛔 = 2.4%) more efficient than the Xylem and Money Maker respectively. At 3 meters head, it was 16.3% (𝛔 = 3.8%) and 26% (𝛔 = 4.1%) more efficient respectively. At 4 meters, the differences decreased to 2.2% (𝛔 = 4.6%) and 9.7% (𝛔 = 4.6%). At 5 meters the Xylem pump was 6.8% (𝛔 = 4.9%) more efficient than the Buffalo pump and the Money Maker was only 2% (𝛔 = 3.7%) less efficient than the Buffalo.
Until the correlation between power and efficiency can be determined, these conclusions include an error assumed to be negligible. It is within the best interest of further research to try and describe this correlation, which may appear something like this:
For low C values (<<1), our assumption can be considered valid. Our current assumption is that C=0, where efficiency is not a function of power. It would also be beneficial to direct further research at determining the range of pressure heads most frequently encountered in real world irrigation situations. This information will be critical in determining which human powered water pump is the most efficient for its given application.
Conclusion
Our research finds that the Buffalo pump is more efficient than the Xylem treadle pump up to 4.5 meters pressure head, and the Money Maker up to 5.5 meters pressure head. The efficiency advantage of one type of pump over another will depend largely on pressure head. Figure 9 shows the efficiency trends between two treadle style pumps and a centrifugal-type water pump.
References
| [Polak] | P. Polak, "How IDE Installed 1.5 Million Treadle Pumps in Bangladesh by Activating the Private Secotr: The Practical Steps," International Development Enterprises (IDE), 2000. |
| [McKay] | A. Mckay. (2018), "The Water Buffalo: Design of a Portable Bicycle Powered Irrigation Pump for Small-Scale African Farmers" UC Davis, Davis, California |